Historical Performance
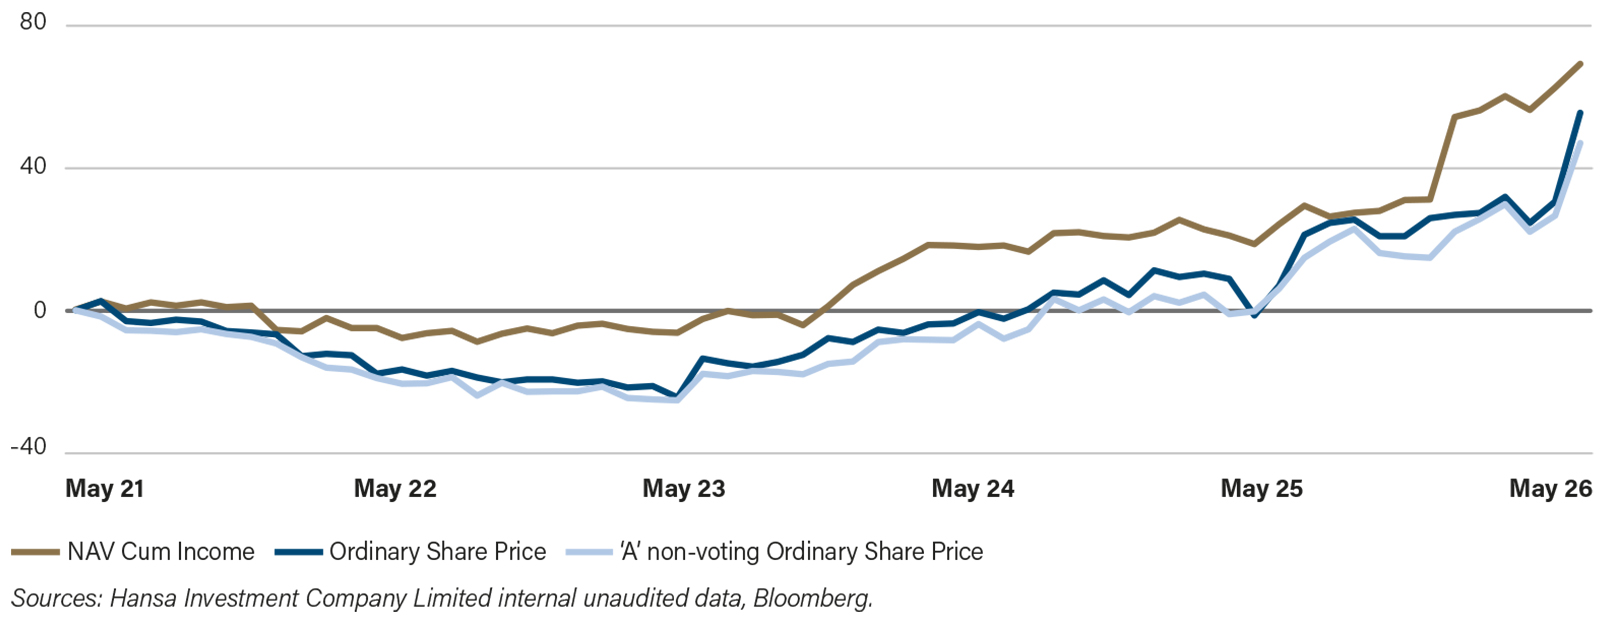
The graph below highlights the 5 year track record showing that the Company has generated a 68.5% total return as at 31st March 2026.
Measuring Performance
Previous to 1 April 2017, returns were compared with an absolute benchmark – the three year return of a five year gilt plus 2% – it providing a comparison with a safe alternative return in pursuit of our goal of growth of shareholder value. However, the Board of Hansa Investment Company Limited considers that the use of a single benchmark won't always offer shareholders the relevance and the clarity needed with regard to the performance of their Company.
The Board continues to compare our returns with those of a safe fixed interest gilt, however using the 10 year UK Gilt Return. Our returns are also compared to the rate of inflation (real returns are important to shareholders) and with those of our peer group and appropriate indices. Additionally, two further KPIs: costs of managing the Company are monitored against the NAV (that ratio is also known as the ‘ongoing charges percentage per annum ratio’) and the discount/premium that the shares sell at in relation to the NAV were likewise monitored.
The Board of Directors monitor the returns made in absolute (firstly) and relative (secondly) terms against the KPIs that they have established for that purpose noted above. The comparisons are made over 1, 3, 5 and 10 years. Henceforth, the Board will now make comment on the Company’s returns when reporting to shareholders by reference to their KPIs and not to a single benchmark that would be appropriate some times and not at other times.
Top 10 Holdings
*Cash from the sale of Wilson Sons is being deployed quarterly over one year, although the Investment Advisor retains the ability to vary this if market opportunities arise. The first tranche was deployed at the end of December 2025 and the second tranche was deployed at the end of March 2026