Historical Performance
The graph below shows the last five years’ performance of Hansa Harbour Fund. It shows performance based on share price movement and also relative performance, rebased to 100, of the share price versus the Fund’s benchmark.
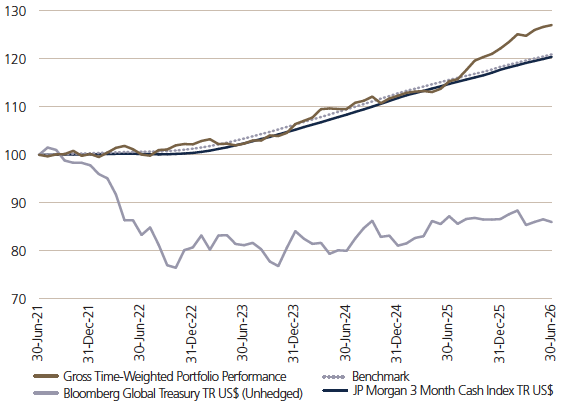
Measuring Performance
The Hansa Harbour Fund Performance Benchmark which came into effect on the 1st August 2019 is a 60:40 composite of the JP Morgan Cash US 3 Month TR Index and the JP Morgan Cash EU 3 Month TR Index +0.75% p.a.